Real document
Read a French research chart with error bars and overlapping groups
Read a French research chart whose bars show explicitly defined score ranges. Interpret overlapping ranges without treating them as proof of significance.
- B2
- Notice
- Read and answer
- Learn this in the B2 notebook →
In short
Read what the bars represent before interpreting overlap. Here each bar runs from the lowest to the highest observed score, not a confidence interval. Overlap shows shared score ranges; it does not by itself decide statistical significance.

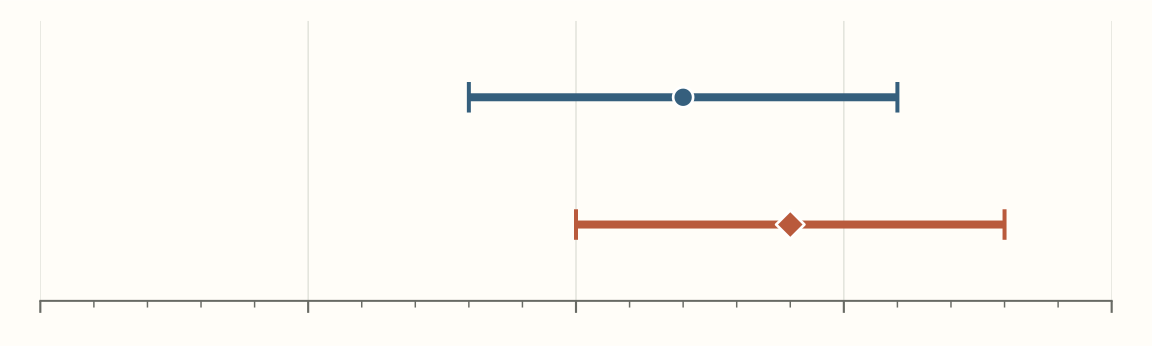
The chart below concerns scores out of twenty in two groups. Its bars are defined as observed minimum-to-maximum ranges. The means and endpoints are supplied in text so the comparison remains readable without relying on an illustration.
Graphique de lecture · score sur 20
Légende
Point centralMoyenne du groupe
BarreDu score minimum observé au score maximum observé
ImportantCes barres ne sont pas des intervalles de confiance
Groupe A
Effectif20 personnes
Moyenne12
Barre minimum–maximum8–16
Groupe B
Effectif20 personnes
Moyenne14
Barre minimum–maximum10–18
| Group | Minimum | Mean | Maximum |
|---|---|---|---|
| A | 8 | 12 | 16 |
| B | 10 | 14 | 18 |
Separate means from individual ranges
B’s mean is two points above A’s mean. The ranges overlap from ten to sixteen. This means some score values lie within both groups’ observed range; it does not mean every participant in B outscored every participant in A. A mean is a group summary, while a range describes its observed extremes.
La moyenne de B est plus élevée, mais les plages de scores observés se recoupent.
B’s mean is higher, but the observed score ranges overlap.
In another chart, bars might represent standard deviations, standard errors or confidence intervals. Their interpretation would then change. Never transfer this page’s range definition to an unlabelled figure. Ask for the legend and method, then report only the comparison those definitions support.